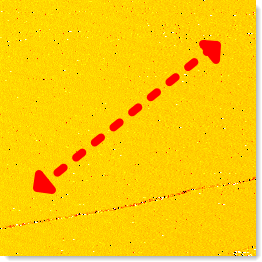
Roughness parameters are determined in two or three dimensions. Use self-defined cuts or selected areas within your microscopy data or evaluate entire images and image sequences. Here comes the strength of the dotCube software into play: Working with large data bundles happens easily and fast. The results are inserted into tables and neatly arranged plots. And every result is calculated as exact as always expected from dotCube.

dotCube performs the roughness calculations according to well-known international standards DIN4768, ASME B46.1 and ISO 4287/1 which are stated in our documentation as well as in the roughness control panel. We set trends even beyond the common technical standards: The precision of the subsurface adjustment prior data evaluation of dotCube is still unreached giving exceptional precise results even from tilted and distorted images.
Vertical variations of roughness profiles are characterized by their deviation from the mean line. Most of them are well known from statistical analysis and build a common set of amplitude parameters.
The roughness average (Sa) is defined as the sum of the absolute values of image height values divided by their quantity:
The root mean square (Sq) gives the square root of the arithmetic mean values:
The surface skewness (Ssk) is a measure of the asymmetry of surface deviations about the mean plane and is given by:
The peakedness of the surface height distribution is described by the surface kurtosis. Its value is calculated by:
The peak-peak height (Sz) is defined as the maximum height difference between the heighest and the lowest point of the image:
The ten point height (S10z) is the sum of the average five highest and average five lowest values of an image:
The maximum valley depth (Sv) indicates the lowest height value of the image meaning the value of the deepest valley:
The maximum peak height (Sp) declares the maximum height value of an image meaning the value of the largest peak:
The mean value (Smean) gives the average height value of the image:
The hybrid parameters combine characterizational measures for both amplitude and spacing of the sample's topography.
The mean summit curvature (Ssc) describes the average curvature of local maxima:
The root mean square gradient (Sdq) states the statistic root mean square value of the surface slope:
The root mean square (short: rms) value with stronger correlation of neighbouring pixels is called root mean square slope (Sdq6) and takes 6 or 3 neighbour pixels for the 3- respectively 2-dimensional case into account:
The surface area ratio (Sdr) shows how much the topographic surface differs from its projection on the (x,y) plane as a completely flat layer:
The elements of the surface area ratio formula give the surface as well as the area of the analyzed sample region: the nominator states the surface area and the denominator the projected area into the (x,y) plane.
Functional parameters characterize special properties of surfaces which describe their performance in respect of bearing and fluid retention. Different benchmarks rate the performane of a surface for different demands of the designed application. From this wide range of parameters, dotCube provides the most common ones which are described in detail below.
The surface bearing index indicates the ratio between root mean square value and height at 5% bearing area of an slicing plane parallel to the (x,y) plane:
Properties of surfaces preserving fluids are characterized by the core fluid retention index. A scratchy worn surface exhibits a lower index than a freshly created and smooth one. The index is determined by the following formula: