Analysis and Optimization
Too much confusing data?
We focus on the essentials.
Based on our experience in university research, we create customized tools to evaluate large amounts of data, find correlations and visualize the results ready for presentation. We use known mathematical methods such as correlation metrics and analyze possible interdependencies. For further investigations, we can rely on simulation methods and carry out disturbance analysis. Based on polynomial constraints, we optimize your project for certain target values such as margin or best cost-benefit ratio.

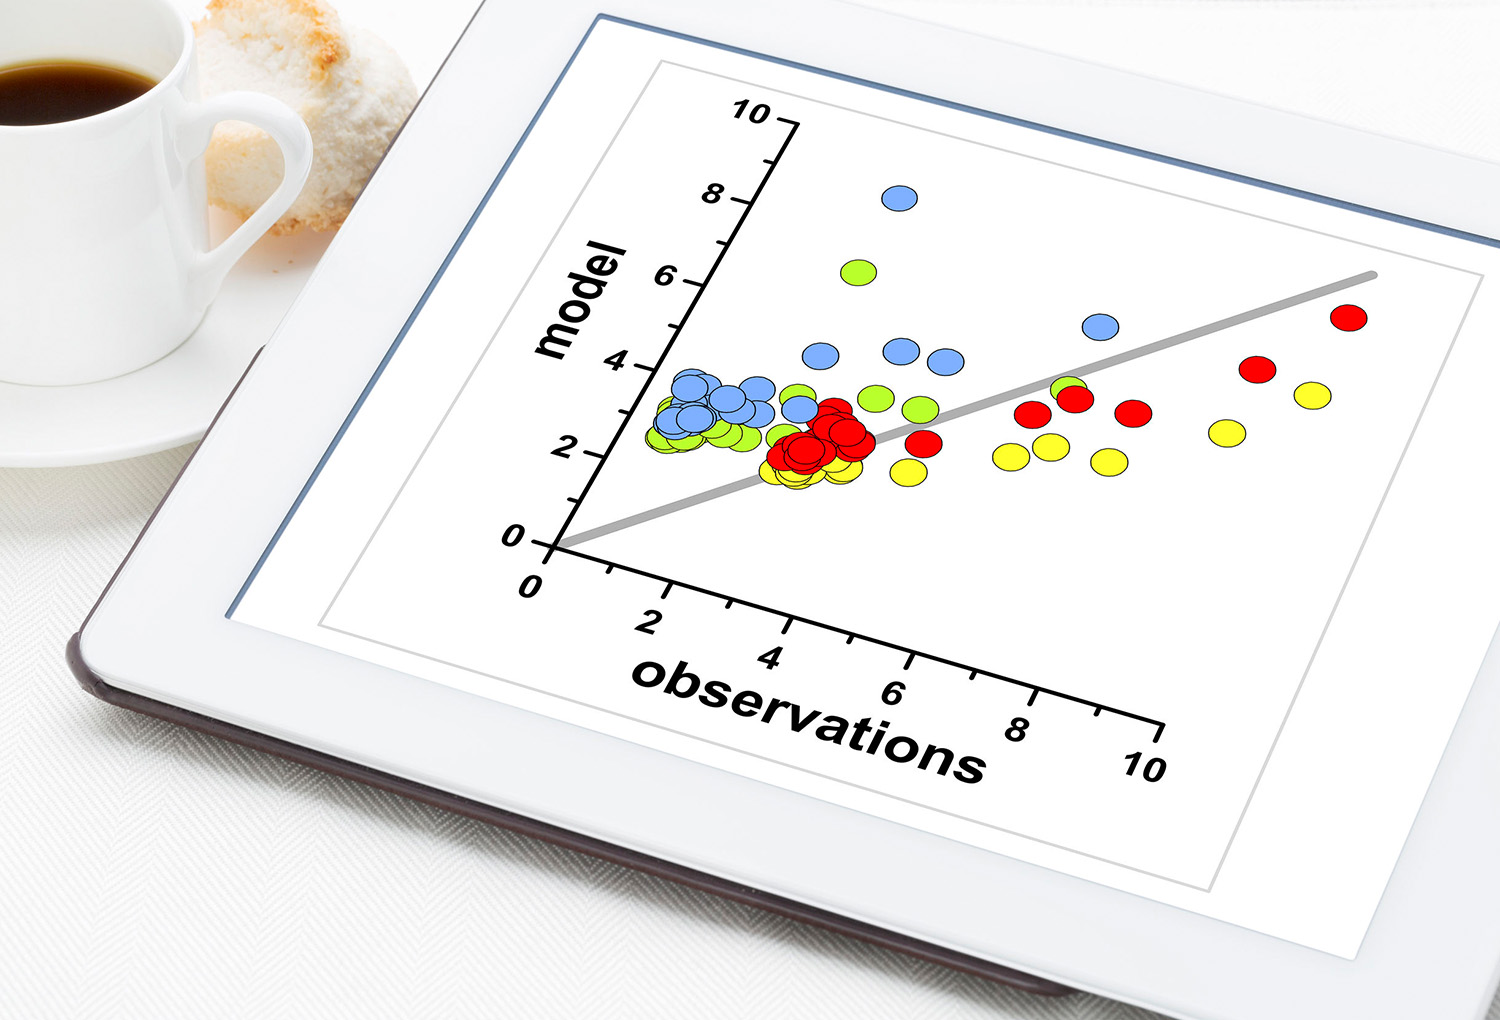
Data correlation
Correlations are data dependencies with their values proceeding in tandem or an opposed way, for instance if a value of a data source increases and at the same time a value from another data source increases or decreases. Applied correlation functions according to Bravais-Person or Spearman give a first impression which variables should be investigated in more detail. We supply you with suitable tools or perform an analysis specially adapted to your requirements.
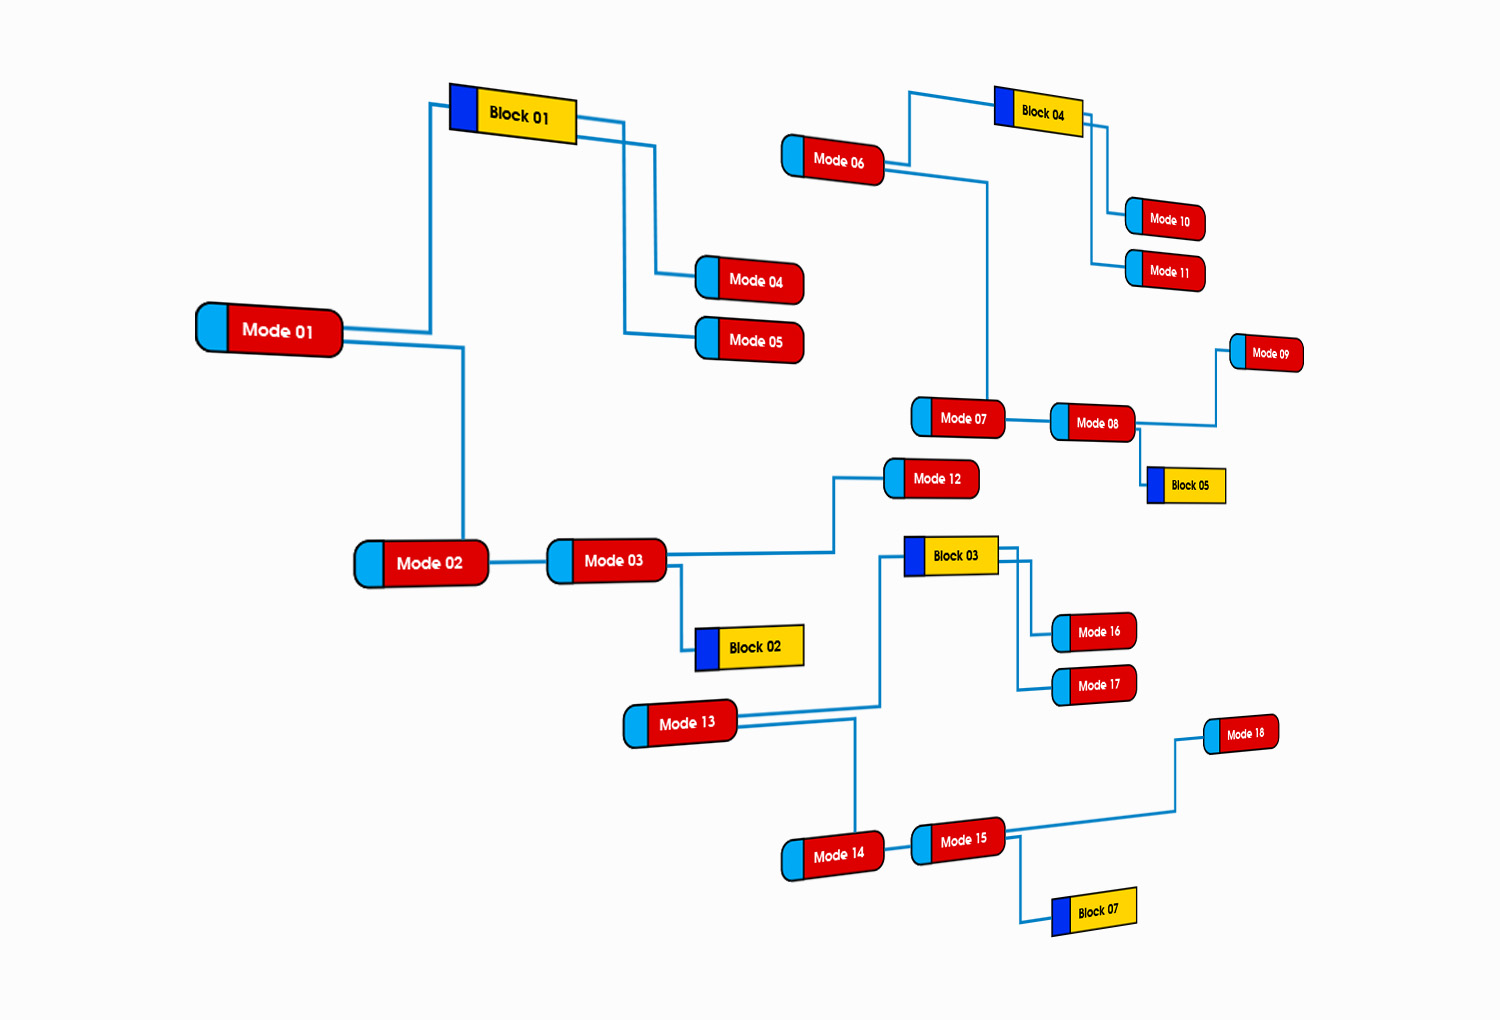
Tools & Visualization
After completion of a comprehensive analysis, data management and its visual representation are the next steps. We create and configure appropriate systems to archive large data sets and facilitate a clear and secure administration. We employ our own tools as well as the standard tools Mathematica, Matlab and Simulink depending on which suits best to quickly and easily obtain realtime or event-based graphics.
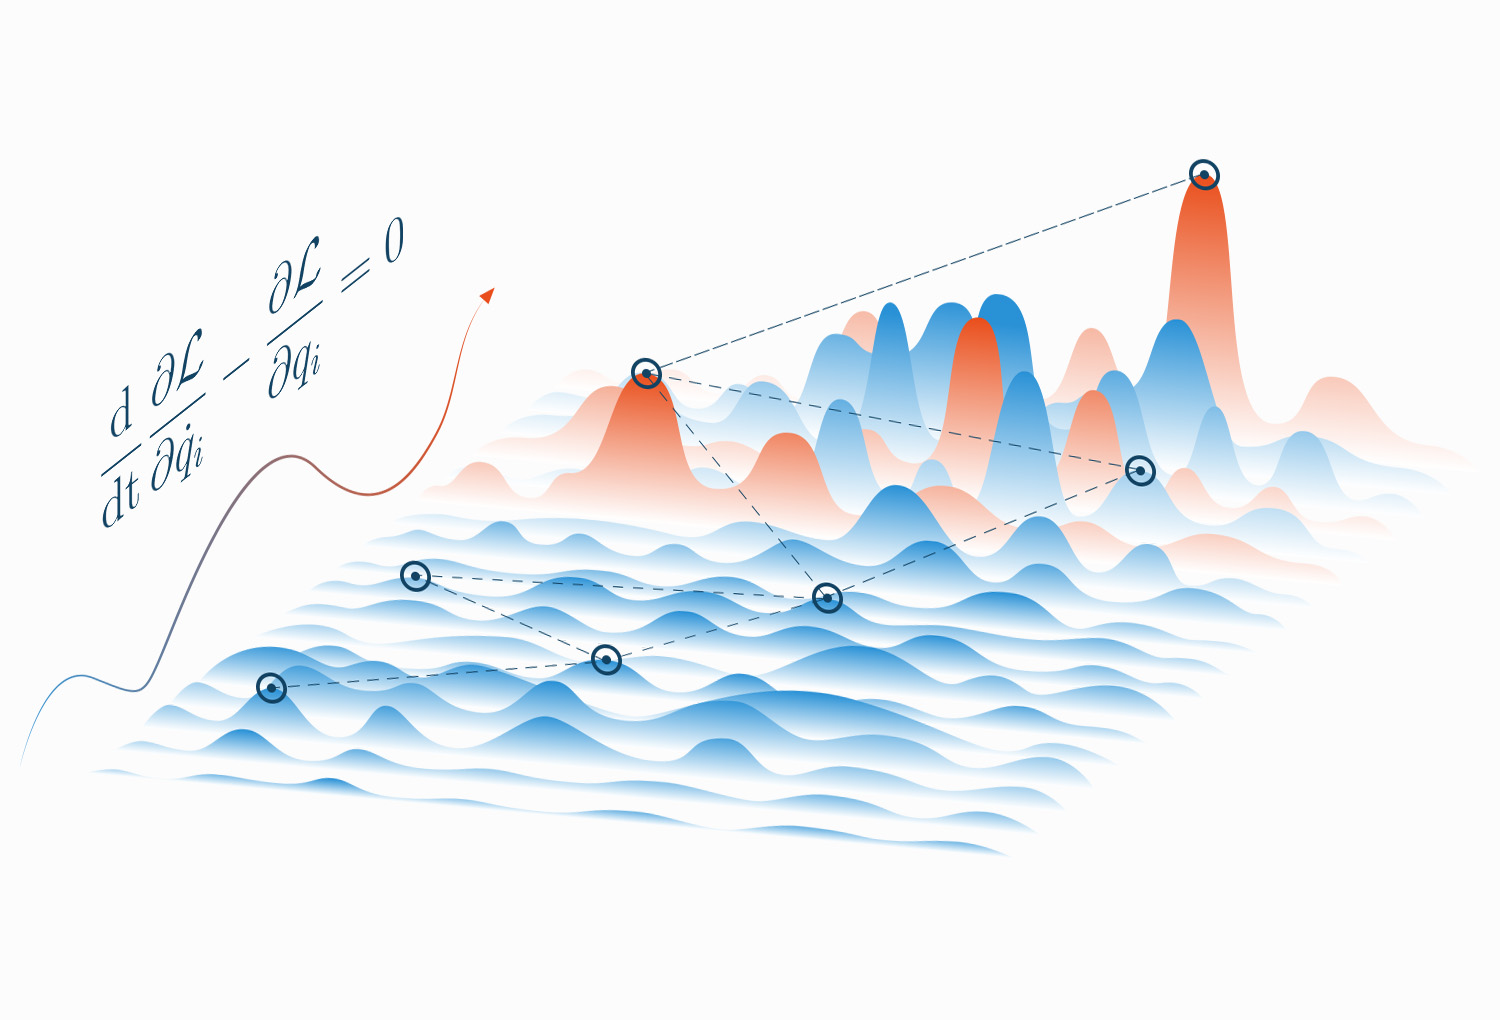
Operations Research
Linear and polynomial higher order optimization restricted by complex formulas are components of any carefully adjusted system in the field of cost-benefit and ingredient calculations. Our solvers provide results in realtime to modify production chains yielding to best returns.

Simulations
Event and time-resolved simulations reduce prototyping costs in system optimization. Our analytical tools detect important data components, investigate their behaviour in simulations, verify the results in the light of further disturbances and display the solutions graphically.