Plots
The creation of graphs and diagrams is an important element in everyday scientific life. Therefore, dotCube supports you with a detailed function library for two- and three-dimensional plots. Pre-made default settings allow you to quickly create good-looking graphs and modify them in almost all areas if needed. With the extensive export possibilities you can present your results quickly and easily.
Two-dimensional plots
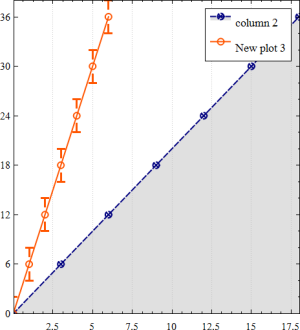
Height profiles, parametric plots, trajectories and representations of correlations - the possibilities of two-dimensional graphs are almost unlimited. Just as manifold are the setting options in dotCube: logarithmically scaled axes, asymmetric error bars, detailed legends. Select quickly and easily an interesting function area by drag-and-drop and zoom by rotating the mouse wheel. For exact definition of functional areas, there are of course numeric input fields. Working with dotCube in this way is easy and efficient.
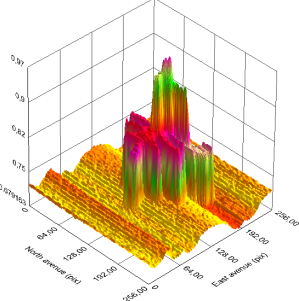
Three-dimensional plots
Developing a vivid picture of a large amount of recorded data is often difficult. For a comprehensive analysis, however, it is imperative to get the most realistic idea of the results. This is where our three-dimensional plot function library comes in: It closes the gap between a two-dimensional representation of raster data and your imagination. Detailed lighting and rendering settings provide a great three-dimensional experience and illustrate the results of your microscope image in space.